Indian migrants of Kerala in the Web By Marie Percot & Philippe Venier
Abstract
Since the 1970s, the South-Indian state of Kerala has known a high rate of international migration. Keralese people represent today almost half of the 4 million Indian migrants in the Persian Gulf countries. More recently, a minority of them has also started to migrate to Western countries. But the location of Keralese migrant websites by no means reflects their actual geographic distribution. Although over 80% of Keralese migrants live in the Persian Gulf, almost no migrant websites appear there. One reason could be a very strict control of the Web in these countries. A large majority of migrant websites are located in the USA, then in India. The “American” websites (associations or general information sites) point towards Indian or Keralese institutional sites addressing Non-Resident Indians: most are sites for investments, money transfers or regard higher education. Few Indian websites point towards the countries of migration. The strong link with the home country, very visible on the Web, could well be the sign of a community whose migration is still too recent to have developed a true diasporic behavior.
Marie Percot is an anthropologist affiliated with the Laboratoire d'Anthropologie Urbaine/Institut Interdisciplinaire d'Anthropologie du Contemporain (French National Center for Scientific Research/École des Hautes Études en Sciences Sociales). She has worked extensively on the anthropology of labour and anthropology of migration. Since 2000, she has been carrying out research on the migration of Kelarese nurses to Gulf and Western countries.
Philippe Venier, a geographer, holds a PhD and is a senior lecturer at the University of Poitiers (France). A member of MIGRINTER, a research center specialized in international migration studies, his current research focuses on Keralese migrants in the Gulf countries : evolution of socio-professional profiles, processes of long-term settlement, second-generation issues and their relations with the country of origin.
Concepts, Tools & Methodology
Dana Diminescu, Mathieu Jacomy & Matthieu Renault
1) Shaping Concepts
e–DIASPORA: A migrant community as it organises itself and acts via various digital media, particularly on the web, and whose practices are those of a community whose interactions are ‘enhanced’ by digital exchange. An e–diaspora is a dispersed collectivity1. It is both ‘online’ and ‘offline’, so what interests us is both the digital ‘translations’ of ‘physical’ actors/phenomena (the online activities of associations for example) and the specifically (‘natively’) digital actors/phenomena (e. g., a forum and its internal interactions), what are sometimes called pure players. The question of ‘rub–offs’—reciprocal influence between these two sorts of web entity—is of capital importance in analysis of an e–diaspora. It's thus clear that research carried out in the context of the e–Diasporas Project presupposes a knowledge of the diaspora in question and, based on exploration of the web, calls on new research in the field. It also implies a knowledge of the web and an appreciation of the singularity of the exchanges that take place there.
DIASPORA WEB: An ensemble of the ‘migrant sites’ and ‘neighbouring sites’ (cf. infra) of a given diaspora, whether such sites be ‘living’ or ‘dead’ (cf. infra, ‘dead site’). In a sense, the web ecosystem of a diaspora.
e–DIASPORA CORPUS: The constitution of a corpus of websites is the method used to ‘capture’ an e–diaspora. A question of breakdown and selection that allows extraction of a diaspora web, it is also a task of definition in that a diaspora web presents itself to a researcher only as a product of this ‘excision’ performed upon the web. Similarly, it is only because of such exploration/selection, this filtering/circumscription of a corpus, that what a migrant site actually is takes on meaning.
MIGRANT SITE: A website created or managed by migrants and/or that deals with them (at any rate, a site for which migration is a defining theme). This could be a personal site or blog, the site of an association, a portal/forum, an institutional site, or anything similar. Usage is not the criterion: a site often consulted by migrants (a media site, for example) is not necessarily a migrant site. What distinguishes ‘activity’ is first and foremost the production of content and practice of citation (hyperlinks). On the other hand, a migrant site need not necessarily be situated in a foreign country and may just as easily be in the country of origin. Migrant sites testify to a given e–diaspora's occupation of the web.
NEIGHBOURING SITE: A non–migrant site (or one belonging to an e–diaspora other than the one being studied) which distinguishes itself by its strong connection with the (migrant) sites of a given e–diaspora (governmental or media sites of the country of origin, for example). However, not every site strongly linked to an e–diaspora is necessarily a neighbouring site. To be one it needs to be ‘specific’ to the diaspora in question which is why sites ‘on the fringes of’ the majority of web communities, particularly those in the upper layers of the web, Google, Youtube, Facebook and so on (cf. the diagram below), are not counted as ‘neighbours’. In the e–Diasporas Project, a list of neighbouring sites may be drawn up alongside that of migrant ones. These neighbouring sites discovered during the prospecting phase are not crawled during subsequent prospection but only during the phase of validation so as to gather together all links with the migrant site.
1 That is to say “a heterogeneous entity whose existence rest on an elaboration of a common direction, a direction not defined once and for all but which is constantly renegotiated throughout the evolution of the collective” (Turner). Furthermore, we prefer the term e–diaspora to that of ‘digital diaspora’ since the latter runs the risk of becoming a source of confusion given the increasingly frequent use of the notions of ‘digital native’ and ‘digital immigrant’ in a ‘generational’ sense (distinguishing those born before from those born during/after the digital era). The object of the e–Diasporas Atlas is not the ‘digital migrant’ but the migrant online.
2) Methodology and Tools
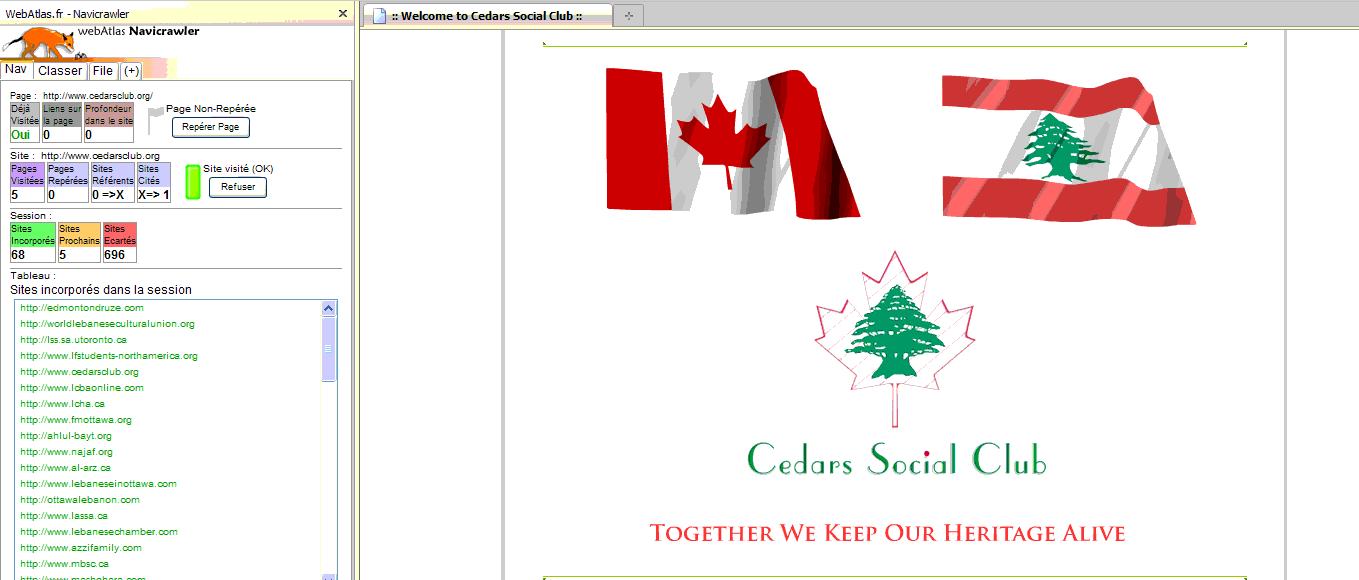
NAVICRAWLER: Navicrawler is an extension of the Firefox Web browser, this is a semi–automatic search tool which analyses the structure and content of pages and hyperlinks in order to assist the user during a browsing session. It helps the researcher in creating a corpus of websites related to his/her topic of study. This tool was developed chiefly by Mathieu Jacomy in the framework of the ICT-Migrations research program.
Download and documentation: http://webatlas.fr/wp/navicrawler/
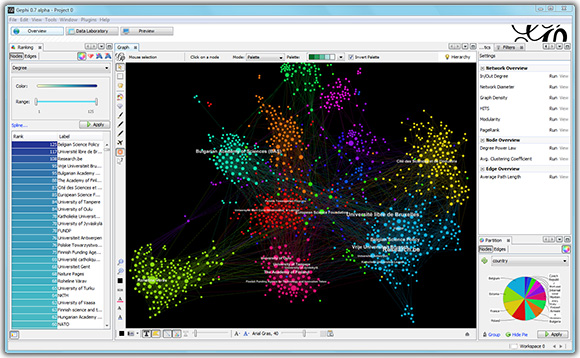
GEPHI: Gephi is an interactive visualisation and exploration tool for all types of networks, complex systems, and dynamic and hierarchical graphs. In the e-Diasporas Atlas, it has been used to visualise and interpret the structuring and distribution of actors in migrant-community networks on the Web. The Gephi project was initiated by Mathieu Jacomy, in the context of the ICT-Migrations research program, and was then developed by Mathieu Bastian and Sébastien Heymann.
Download and documentation: http://gephi.org/
THE AUTOMATIC CRAWL (following the creation of a first Navicrawler corpus): A crawler is a ‘robot’ (computer program) which automatically browses the web based on a given list of URLs and follows all hyperlinks on the pages visited. A depth of exploration (number of successive ‘external’ hyperlinks—between one site and another—to be visited) is fixed as the crawl parameter and the results are stocked in the form of a graph whose nodes are pages or websites (sites in the case of e–Diasporas), and arcs the hyperlinks connecting them (note that, where e–Diasporas is concerned, site content is not indexed). As an example, a crawl to distance 1(visits to initial sites plus those linked to them) on a corpus of around fifty sites will come up with thousands and even hundreds of thousands of results. Most of these are anything but pertinent to a given corpus (we estimate that 1—10% actually are), so the results then need to be filtered. Two pointers are used by e–Diasporas: the number of initial sites referring to a given site discovered, and the number of initial sites to which it, itself, refers.
THE e–DIASPORAS PLATFORM: A site that gathers together all ‘data’ for a particular section of the e–Diasporas Atlas once the validation crawl of a corpus is complete. In a certain sense this is a database of graphs and statistics (automatically generated by the platform based on the classification fields of the given corpus) and can be mobilised by the researcher in the writing of his or her article: http://maps.e-diasporas.fr
ADDITIONAL TOOLS: Over and above the tools specially developed for the e–Diasporas Atlas, there are other applications that may be useful to researchers. This is particularly the case with whois which facilitates the gathering of information concerning the geographical location of sites and their ‘registrants’ (the information sometimes concerns only the localisation of the web host hosting the site and this is of little value). Cf. for example, http://www.coolwhois.com. For other tools developed by Digital Methods in Amsterdam which may prove useful.
Cf. http://wiki.digitalmethods.net/Dmi/ToolDatabase
3) Graph Interpretation
In the context of the e–Diasporas Atlas, it is the graph that primarily allows formulation of research hypotheses. Graphs serve not so much as demonstration/explication as an embodiment of the construction of an interpretation of data. They thus all have a heuristic function, their interpretation being an aspect of visual analytics.
MAPS — BETWEEN GRAPH AND TABLE: Graphs produced for the e–Diasporas project are quite particular. They're actually ‘minor graphs’, at least when compared to those handled by researchers in other fields. There's an essential qualitative aspect to our graphs insofar as the data are extremely precisely described/classified by the researchers. The graph's topological structure (the hyperlinks) independent of the classification of the sites in tabular form is of no interest to us. E–Diasporas maps are a product of the fusion between the structure of graphs and the structure of tables.
Since the networks themselves are small, one can easily ‘see’ the structures, which are never particular complicated: a small number of more or less dense ‘packets’ linked in certain ways, occasionally with points or centres and, and, possibly, a polarisation (cf. infra). The question is ‘Why is it like this?’ and the answer lies in categorisation. One intuitively finds that such–and–such a packet corresponds to such–and–such a particular sort of site, polarises itself according to these other criteria and so on (cf. infra). One examines how the sites classify themselves according to several norms, and needs only count them and draw up proportions and crossovers utilising classical statistics and ignoring links just as if one were dealing with the simple columns of a table describing the sites involved.
THE VARIOUS TYPES OF GRAPH/MAP: There are several kinds of map in the e–Diasporas platform. On its front page the researcher will first find a series of small maps giving an overall view of the various corpuses. These are known simply as thumbnail maps. Clicking on the section that interests them, they will then access a general, ‘unicolour’ map devoid of classifications. This is the so–called map foundation. Exploring this map, they will then gain access to a series of maps coloured according to various fields of classification. These are the so–called thematic maps.
GRAPH ORIENTATION—CENTRE AND PERIPHERY: The ‘north/south’ and ‘east/west’ orientations of nodes comprising a graph have no meaning here. Otherwise put, rotations such as may be applied to a graph have no effect on it: it remains the same graph. All that is to be considered is the relative distribution of its nodes, their position as regards each other (except for nodes whose positions are without connection and which are thus without significance to the graph and may just as well be represented by a list). The notions centre and periphery (be this on a graph as a whole or on some sub–graph) are of far greater importance in this regard in that they inform as to the degree of influence a node has, as also does that of distance. For all that ‘visible’ distance is a source of information, however, it has no ‘absolute’ value: the actual distance between nodes on a graph is the number of links one needs follow to get from one to another. If the arcs of a graph have ‘direction’—which is the case for a web graph—the distance from A to B is not necessarily the same as that from B to A.
IDENTIFYING MAP COMPONENTS—STUDYING CLUSTERING: The first reading of a graph—particularly of a map foundation—consists in the identification of its components. First one identifies clusters, groups of sites far more clearly linked to each other than to the rest of the graph. In the absence of a veritable cluster, particularly when a graph is dense and may, itself, constitute a relatively homogeneous ‘whole’, one may attempt to identify its denser seeming zones. This could also be expressed negatively by attempting to identify its ‘holes’, its ‘empty zones’. It also implies considering whether the graph has a principal component (often the graph's centre) and series of ‘subordinate’ ones, or whether it is simply a multiplicity of components that are actually ‘independent’. Based on this step, the researcher may then identify the reasons for these preferential attachments within the graph and come to understand ‘what makes it cluster’. If this is not clear, they should make use of visualisation (cf. infra) according to category and/or ‘quit’ the graph to look for explanations elsewhere on–site.
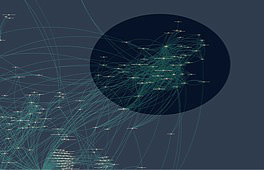
IDENTIFYING A COMMUNITY: How does one identify communities with a graph? Note that a cluster is not necessarily a sign of the presence of a communal structure in the strictest sense of that word. It is not enough, for there to be a community, that there be a few ‘large’ and influential sites (‘hubs’ or ‘authorities’, for which, cf. infra), there also (even only) has to be a multiplicity of ‘small’ sites, well connected among themselves. Simply put, the network should be more like a ‘spider–web’ than a ‘star’.
This (black circle) is a community.
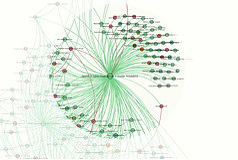
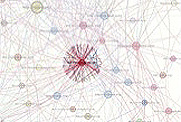
Here there is no community, just a single site linking out to others which are, themselves, barely or not at all connected to each other.
IDENTIFYING ‘HUBS’ AND ‘AUTHORITIES’: In a graph, a hub is a node with a large number of links leading from it—‘a site that cites a lot’, so to speak. An authority is a node with a large number of links leading towards it, ‘a site often cited’, or, one might equally say, a site with a lot of influence. Authorities are easily identifiable in the graphs produced in e–Diasporas: they're the biggest nodes on the graph (the size of the node being determined by the number of links entering it). Hubs are also fairly easily recognisable: they're the ones ‘stars’ form around, or, again, the ones with the most similarly coloured links around them (links of the same colour being those that link away from the node).
A site acting as an authority bears out its influence, its notoriety within the e–Diaspora. Although it's far easier to produce links (links going out) than to receive them, hubs are nevertheless also fairly important in that they can reveal a certain linking policy (if we consider, for example, those institutions trying to ‘catch’ their diasporas by linking themselves to them… the next question being how efficient such policies might actually be).
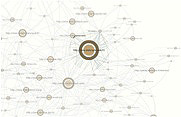
Example of a hub.
Example of an authority.
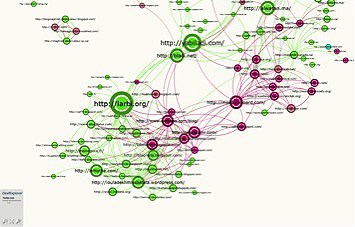
‘BRIDGE’ SITES: ‘Bridge’ sites are sites that play a role of ‘way–station’ between two or more components or clusters in a graph. In the e–Diaspora Atlas, where nodes are precisely qualified and clusters regularly correspond to categories defined by the researchers themselves, the positioning and the interpretation of the content of such sites is often of prime importance. One should reflect on why such–and–such a site has this function within a graph and what it means in terms of the relationship between various ‘actors’ in the e–diaspora.
Several types of ‘bridge’ may be identified including 1) the representative or spokesman, cited by ‘its own’ community and by others, 2) the mediator, which is cited by two communities but belongs to neither, and 3) the translator or commentator, which cites its own community but is not cited by it although it is cited by another.
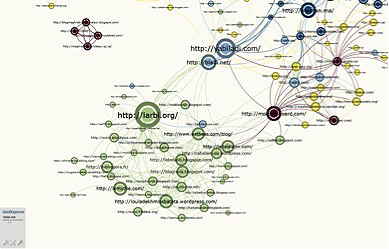
This map is part of the ‘Moroccans’ corpus. The sites yabiladi.com and bladi.net (in the centre) very clearly play the role of ‘bridges’ here. As it so happens, they are community sites (discussion forums) linked to a blogosphere on the one hand (lower left) and to institutional sites (upper right) on the other.
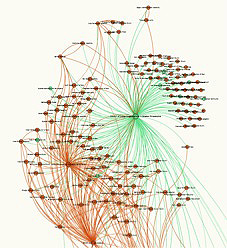
USING THEMATIC MAPS—STUDYING POLARISATION: Having identified the clusters/zones of the graph, one then has to fathom the reasons for these groupings and, to this end, researchers may use the various thematic maps stemming from their classification. Browsing these different maps, they first set out to find trivial groupings, which is to say situations where clusters correspond very clearly to the various values of a given classification field. Sometimes groupings of this kind are not observable, at least for certain clusters. One then has to set about looking for the phenomenon of polarisation by studying the distribution of the graph's ‘colours’/categories. One then examines how these various ‘poles’ distribute themselves, how they ‘constitute links’ between various different clusters.
Lower left: Here we have a trivial grouping: the cluster almost exclusively brings together nodes of the same colour/category, covering, as it happens, migrants of the blogosphere.
Right: Here we have a zone (more than one cluster) containing sites belonging to several categories. In order to interpret a grouping of this nature we will need to explore other thematic maps: let us start by examining that of language distribution...
We may now affirm that the grouping on the right is defined primarily by linguistic criteria. More broadly, what we are looking at here is a polarisation by language ‘over and beyond’ clustering (green=French, red=English), and we can thus see that it is ‘language’ that links the various groups of sites.
‘INTRUDER’ SITES: We speak of ‘intruder’ sites when there is a situation in which a given cluster corresponds very obviously to one category but nevertheless contains a site or sites belonging to another. One then has to inspect why such a site should have ‘inserted itself’ in this way into a domain which is, a priori, not its own. Once again, the intruding site may help in understanding the relationship between various actors in an e–diaspora.
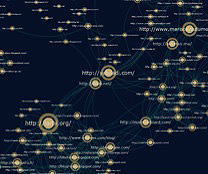
on–religious) in the very heart of a cluster of orange (=religious) ones, especially in that it also exercises the function of a hub.
In this map fragment, colours represent religions. It is quite correct to wonder at the presence of the green site (=non–religious) in the very heart of a cluster of orange (= religious) ones, especially in that it also exercises the function of a hub.


 Home | Working papers | Researchers | About
 Télécharger le working paper
 Access the interactive graphs